
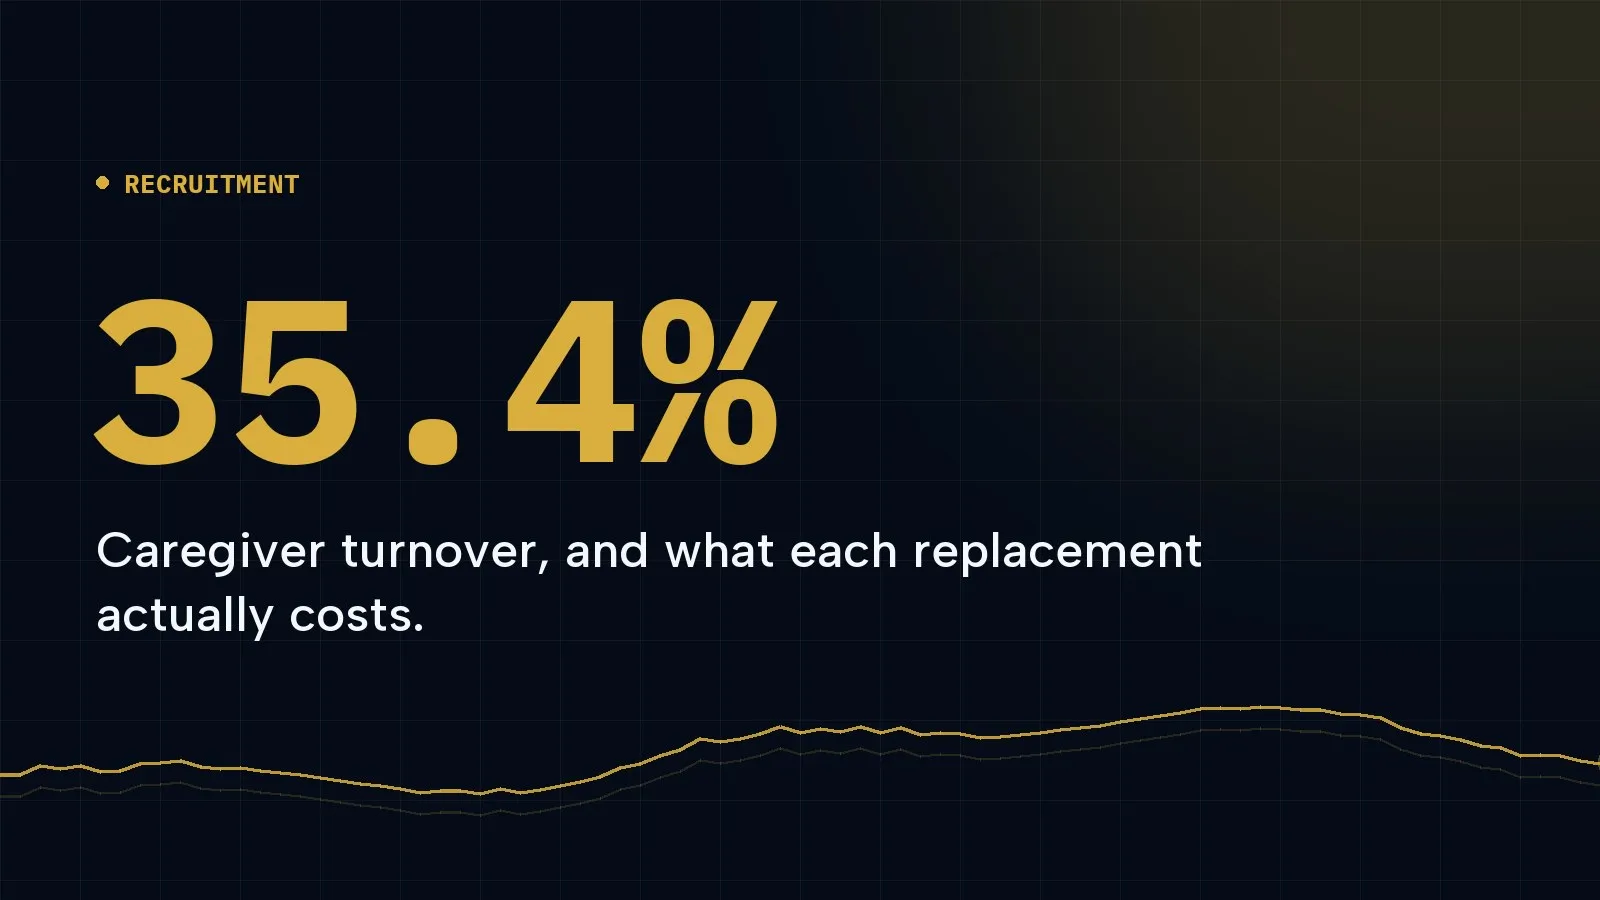
Senior living and care providers reported average total workforce turnover of 35.4% in 2026. Registered nurses ran 40.8%, dining services 40.0%, and CNAs 39.0%.
That figure usually sits in an HR report. It belongs in the marketing conversation, because replacing those people is an acquisition problem, it is funded like one, and in most communities it costs more than the entire census marketing budget.
Turnover is not evenly distributed
| Role | Annual turnover |
|---|---|
| Registered nurse | 40.8% |
| Dining services | 40.0% |
| Certified nursing assistant | 39.0% |
| Housekeeping / environmental services | 26.9% |
| Maintenance | 24.4% |
| All roles | 35.4% |
The spread matters more than the average. A community budgeting one recruitment campaign across all roles is overfunding maintenance and underfunding the two roles that determine whether it can admit residents at all.
Geography moves it as much as role does
| Region | Average turnover |
|---|---|
| Midwest | 41.9% |
| West | 39.2% |
| South | 33.2% |
| Northeast | 30.5% |
An eleven-point spread between the Midwest and the Northeast means the same job posting, at the same wage, with the same creative, produces materially different economics depending on the building. Multi-site operators running one national recruitment budget are systematically underfunding their Midwest communities.
What it actually costs
Run the arithmetic for a single 100-bed community.
Assume 60 direct care staff and 35.4% turnover. That is roughly 21 replacements a year. Industry estimates for the fully loaded cost of replacing a frontline care worker (advertising, screening time, onboarding, orientation, and the agency cover used while the role is open) commonly land between $3,000 and $5,000 per hire.
Twenty-one replacements at that range is $63,000 to $105,000 a year, in one building.
Most operators of that size are not spending that on census marketing.
That is the whole point. The largest acquisition line in a senior living community is frequently not resident acquisition. It is staff replacement, and it is usually managed reactively, on the job board treadmill: a posting goes up when someone quits.
The reactive-hiring trap
At 39 to 41% turnover, a role is not an event. It is a rate.
Posting a job when a nurse resigns means starting a 30-to-60-day pipeline for hard-to-recruit clinical staff on the day the gap opens, and covering the gap with agency staff in the meantime. AHCA reports that agency use has fallen 45% since its peak, and the operators driving that decline are the ones who stopped treating hiring as an event.
The alternative is a continuously running hiring pipeline: always-on advertising for the two or three roles you know will turn over, a landing page that converts on a phone, automated screening, and interview booking that does not depend on someone returning a call. That is recruitment marketing run like a sales funnel, and it is the same machinery as census marketing pointed at a different audience.
Why this belongs next to census, not in a separate budget
63% of assisted living communities report a current staff shortage, and 87% report difficulty hiring.
Meanwhile occupancy is near 90% and rising. Those two facts collide in one place: a community that markets its way to a waiting list and cannot staff the floor has not grown. It has converted a marketing win into an operations problem, and usually into agency spend.
This is why we run both funnels on one programme and report them side by side. The trade-off between them is real and constant. Spend on census when you cannot staff, and you buy a problem.
What to change
- Fund by role, not by headcount. RN and CNA campaigns should be permanently on. Maintenance can be reactive.
- Fund by region. If you operate in the Midwest, budget for a 41.9% rate, not a 35.4% one.
- Measure cost per hire against agency cost avoided, not against cost per click. Agency cover is the real alternative, and it is the expensive one.
- Put replacement cost in the marketing conversation. Once someone has seen the $63,000 to $105,000 range for a single building, the argument about recruitment advertising budget usually ends.
Source: Turnover by role and region from the 2026 State of the Senior Living & Care Workforce report. Shortage, hiring difficulty and agency use figures from AHCA/NCAL’s 2026 long-term care workforce reporting. Replacement cost is a range drawn from published industry estimates, not our own client data. See the methodology page for how we treat figures we did not measure ourselves.