
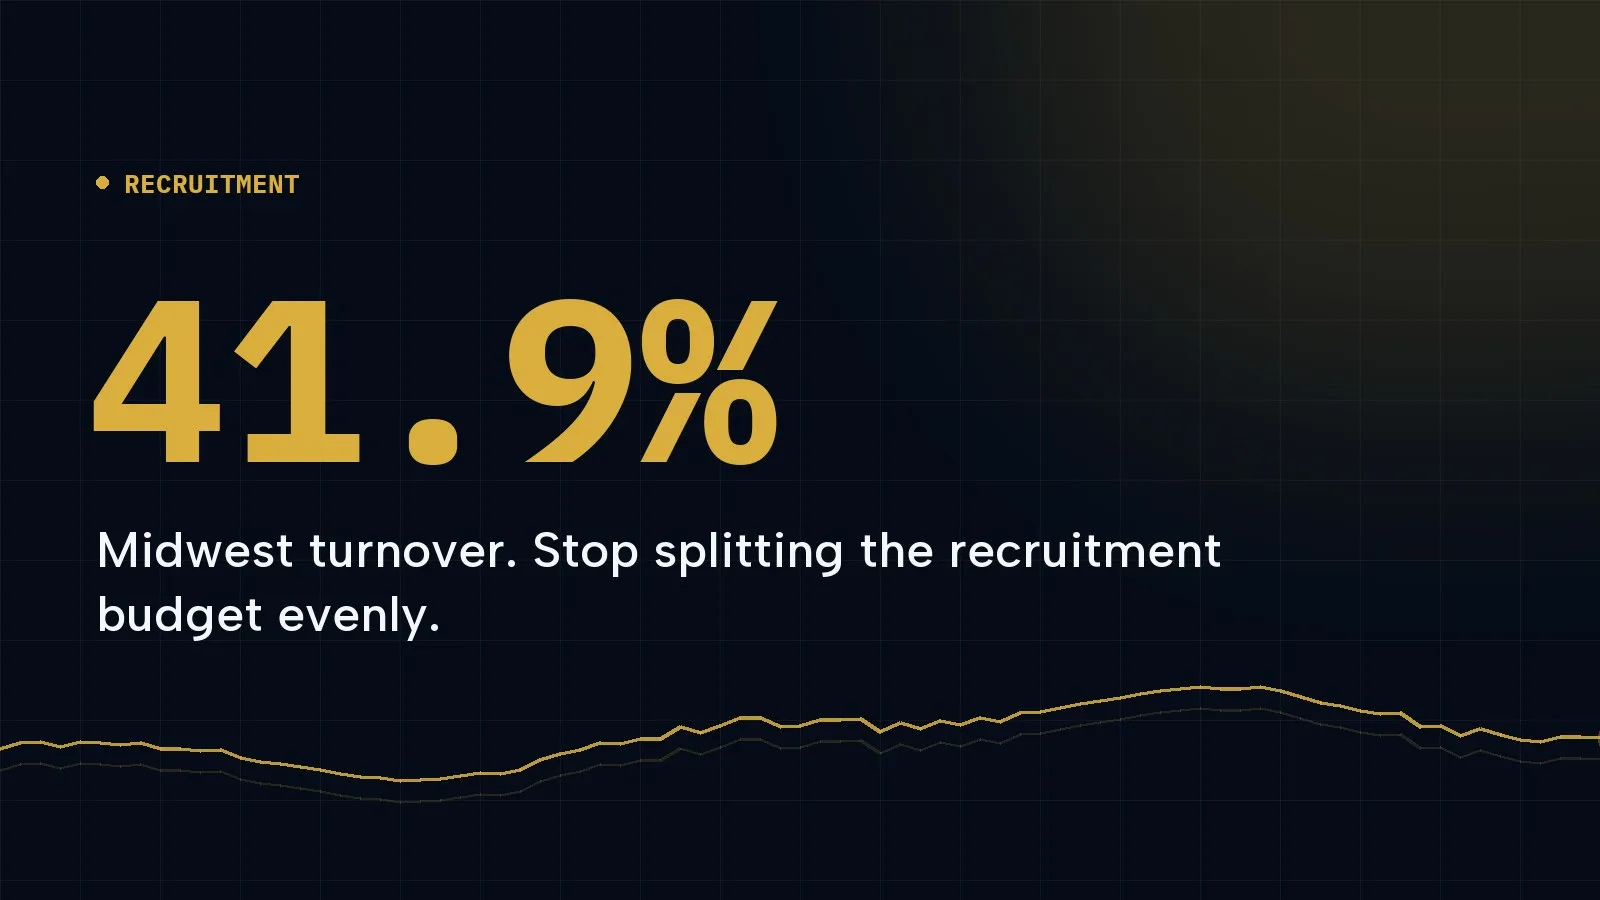
Workforce turnover in senior living runs 41.9% in the Midwest and 30.5% in the Northeast. That is an eleven-point spread on the same roles, the same job titles, and frequently the same operator.
Most multi-site operators still divide one recruitment budget evenly across buildings, or by headcount. Both methods systematically underfund the markets that generate the most vacancies.
The spread
| Region | Turnover | Relative to the 35.4% average |
|---|---|---|
| Midwest | 41.9% | +18% |
| West | 39.2% | +11% |
| South | 33.2% | −6% |
| Northeast | 30.5% | −14% |
A Midwest building generates roughly 37% more vacancies per year than a Northeast building of the same size. Funded identically, its cost per hire will be higher, its time-to-fill longer, and its agency spend larger, and the annual review will read that as a local management problem.
Why headcount allocation fails
Headcount is a proxy for how many people you employ. Recruitment demand is driven by how many you have to replace, which is headcount multiplied by turnover.
Two 60-bed buildings:
| Northeast | Midwest | |
|---|---|---|
| Direct care staff | 60 | 60 |
| Turnover | 30.5% | 41.9% |
| Replacements per year | 18 | 25 |
| Budget under even split | $30,000 | $30,000 |
| Implied budget per hire | $1,667 | $1,200 |
Same money, 28% less per hire in the market that is harder to hire in. The even split does not merely fail to help the Midwest building. It actively disadvantages it.
The allocation model
Three inputs, in order of weight.
1. Expected replacements. Headcount multiplied by regional turnover, by role. This should drive most of the allocation.
2. Local labour competition. Not competitor communities, but the whole local market for the same worker. Frontline caregiving competes with retail, warehousing and hospitality for the same applicants, and where those employers are dense and paying well, cost per applicant rises regardless of how many senior living operators are nearby.
3. Role mix. RN at 40.8% and maintenance at 24.4% are different problems. A building with a heavier clinical mix, where recruiting is hardest, needs more budget than its headcount implies.
A defensible starting split is to allocate on expected replacements, then adjust by up to 20% for local labour competition.
Reworking the example
Same two buildings, same total $60,000, allocated on expected replacements rather than headcount:
| Northeast | Midwest | |
|---|---|---|
| Replacements | 18 | 25 |
| Share of total | 42% | 58% |
| Allocated budget | $25,100 | $34,900 |
| Budget per hire | $1,394 | $1,396 |
Now both buildings are funded to the same standard. That is the whole point: not spending more, spending proportionally.
What to do once the number moves
Allocation alone does not hire anyone. It funds a pipeline, and the pipeline still has to exist: always-on advertising, a phone-first apply page, automated screening, self-serve booking, SMS follow-up. Reallocating budget into a reactive process just buys more expensive job postings.
The sequence that works: build the recruitment funnel in one market, prove cost per hire against agency cost avoided, then allocate across the portfolio on replacements.
The reporting change
Stop reporting cost per hire as a portfolio average.
A portfolio average hides the exact thing you need to see, which is whether your hardest market is funded to the same standard as your easiest. Report cost per hire by building, against expected replacements, and the outliers identify themselves.
If one building’s cost per hire is 40% above the portfolio, the question is whether that is a management problem or an allocation problem. Under an even split it is usually the second, and it has often been misdiagnosed as the first for years.
Source: Turnover by region and role from the 2026 State of the Senior Living & Care Workforce report. The allocation model is ours, and the worked figures are illustrative: published turnover rates applied to a hypothetical 60-bed building, not client data. See the methodology page for how we separate measured results from modelled ones.