
Senior housing occupancy reached 89.9% in the second quarter of 2026, a twentieth consecutive quarterly gain. That is the number that will be quoted in every trade headline this month, and it is the least useful number in the report.
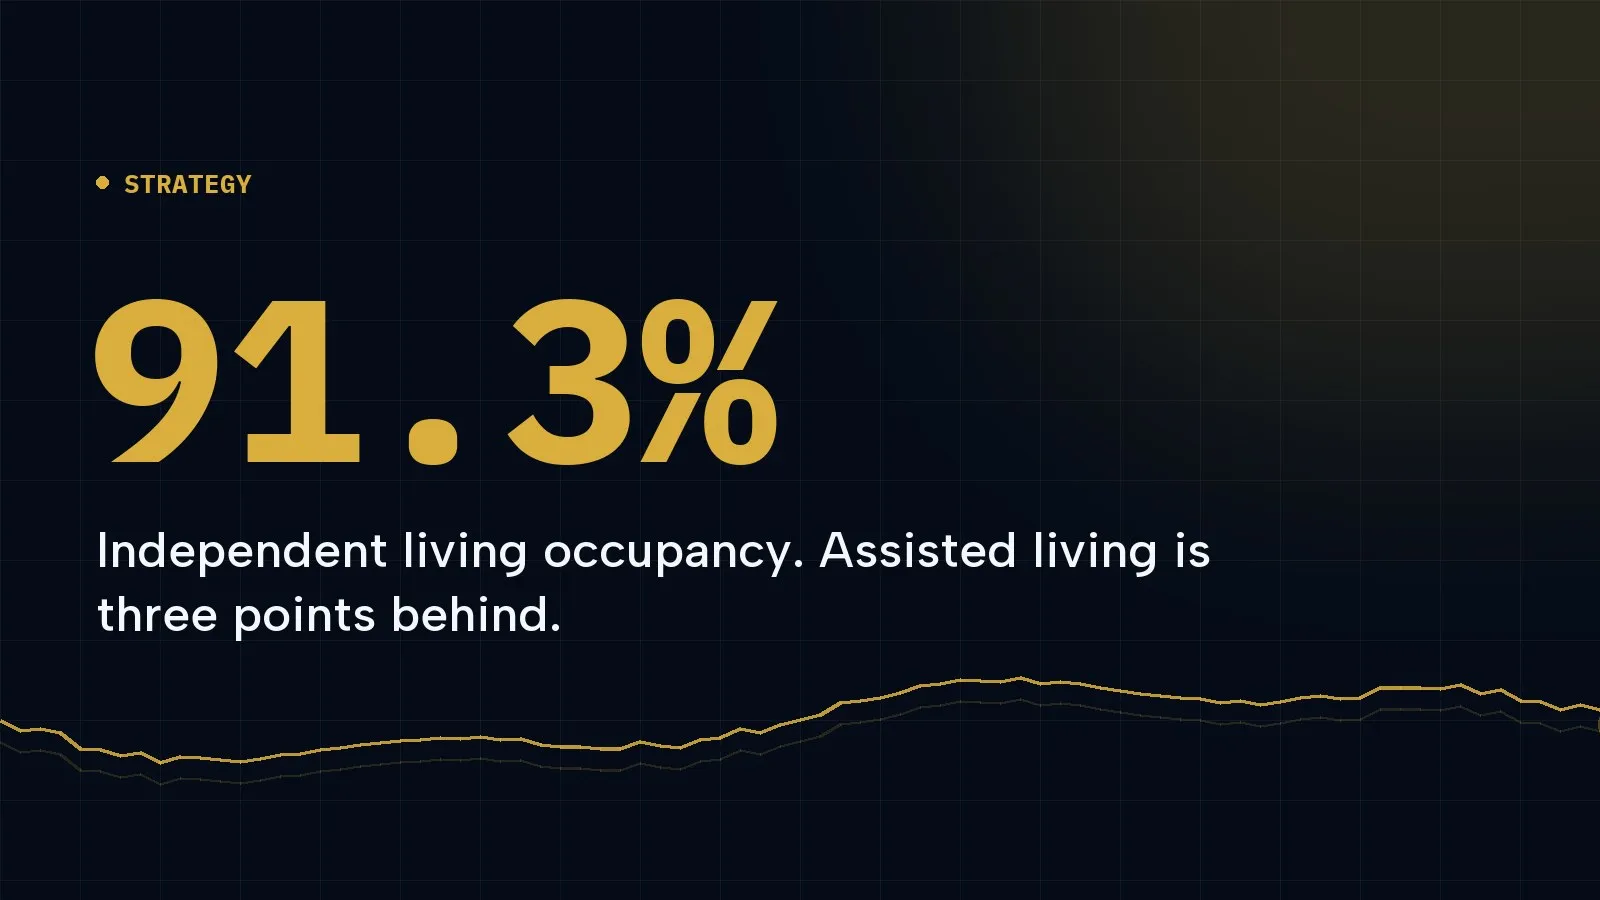
Underneath it, the care levels are three points apart:
| Care level | Occupancy | Quarter change | Annual rent growth | Annual absorption |
|---|---|---|---|---|
| Independent living | 91.3% | +20 bp | 4.4% | 2.2% |
| Assisted living | 88.4% | +50 bp | 4.9% | 3.0% |
| Nursing care | 87.3% | +10 bp | 5.6% | 1.0% |
| All senior housing | 89.9% | +40 bp | 4.6% | 2.6% |
Source: NIC MAP, Market Fundamentals 2Q 2026, top 31 primary markets.
Three points of occupancy is not a rounding difference. On a 120 unit building it is roughly three and a half apartments, every month, and it is the difference between a waitlist problem and a vacancy problem. If your operation runs both care levels and one budget, you are funding them as though they face the same market. They do not.
What the split actually says
Independent living is close to full and slowing. At 91.3%, with the smallest quarterly gain of the three and the lowest rent growth at 4.4%, IL is running out of room to grow by filling units. The remaining vacancies are specific: particular floor plans, particular price points, particular buildings. Marketing that buys general interest will produce inquiries for apartments you do not have.
Assisted living has the momentum. It gained the most this quarter, 50 basis points, absorbs the fastest at 3.0% a year, and pushes rate harder than IL at 4.9%. AL is where demand is still converting into occupancy at pace, and it is also where the sales cycle is short enough for speed to matter: the inquiry that arrives today is often deciding this month.
Nursing care is a different business. Highest rent growth at 5.6%, slowest absorption at 1.0%, and inventory actually shrinking by 0.2% a year. Occupancy is rising because supply is leaving, not because demand is being won.
Why nothing is coming to relieve it
Annual inventory growth across senior housing is 0.4%, and construction stands at 2.2% of existing inventory, with rolling four quarter starts at just 0.7%. In plain terms: almost nothing is being built, and what is being built will not arrive for years.
That is what makes the current market unusual. In most tightening markets, high occupancy invites supply, supply arrives, and the advantage closes. Here, the supply response is absent. The tightness is structural for the next several years, which is why the forecast for stabilised occupancy near 93% by 2028 is credible rather than optimistic.
What this changes in a marketing budget
Stop planning both care levels off one number. An IL campaign aimed at a building at 91% and an AL campaign aimed at a building at 88% are different jobs. The first is a mix and rate problem. The second is still a volume problem, and what a lead should cost differs by care type accordingly.
Fund assisted living for speed. AL is absorbing three times faster than nursing care and is the fastest-moving of the three. In a market moving at that rate, response time is a competitive weapon rather than a nicety.
Fund independent living for the long courtship. IL sales cycles run many months and often more than a year. Budget for nurture, waitlists and events, and judge the channel on inquiries that mature rather than inquiries that close this quarter.
Price is doing more work than it used to. Rent growth of 4.4% to 5.6% across the care levels means most operators have raised rates through a period of rising occupancy. That works until it prices out the prospect who was nearly qualified, which is a segmentation problem before it is a rate problem.
The number that still matters more than any of these
None of this is your market. The national figure covers the top 31 metropolitan markets, and inside that average sit markets above 95% and markets in the low 80s. A plan built on the sector number will be wrong in one direction or the other, which is why it is worth checking whether your own market is actually tight before you move a dollar.
What the sector number is good for is direction. Twenty consecutive quarters of gains, almost no new supply, and rent growth above inflation together say the same thing: the constraint on growth is moving from finding demand to serving it. That is a different marketing brief, and it changes what the budget is for.
The operators who will look smart in 2028 are the ones who noticed that their two care levels stopped sharing a market, and stopped funding them as though they did.
Related from Inertia